
How do you judge corporate performance? When thinking about how well a company is doing, most people generally look into the company’s balance sheets, and percentages. But, there is more to it than just numbers.
What’s really important is how the company is doing in the real world. Looking at it this way provides a direct reflection of our daily lives. It is pertinent to understand that when a business thrives, it creates jobs and brings money to people’s pockets. Thus, corporate health is a direct indicator of healthy economic conditions.
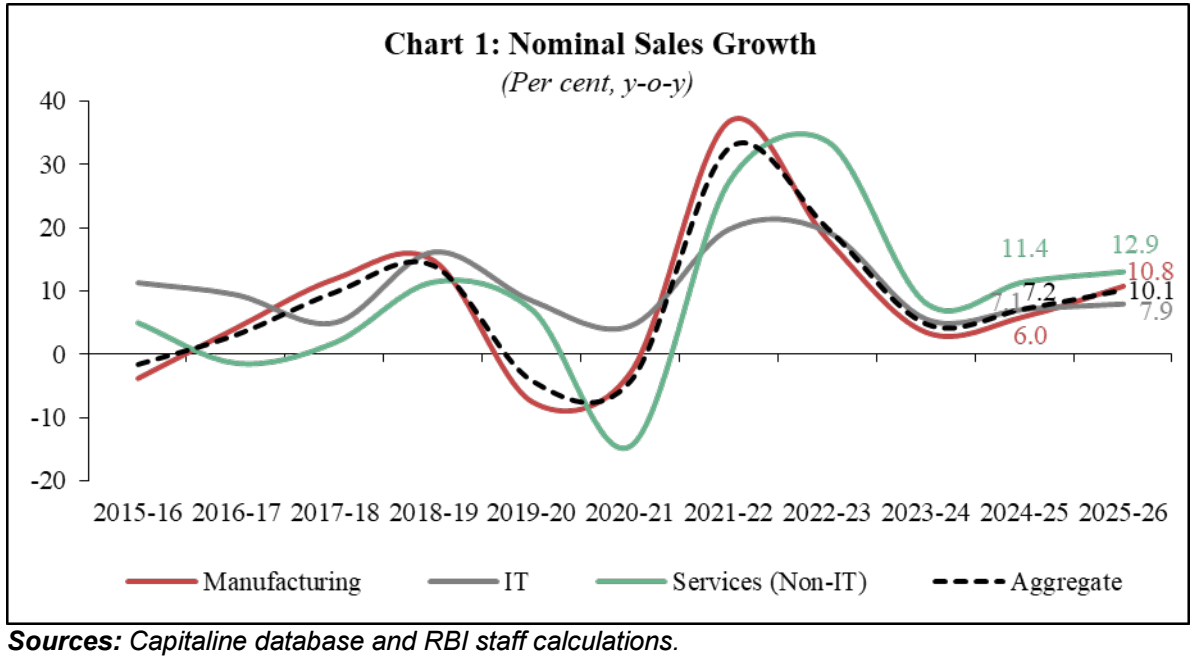
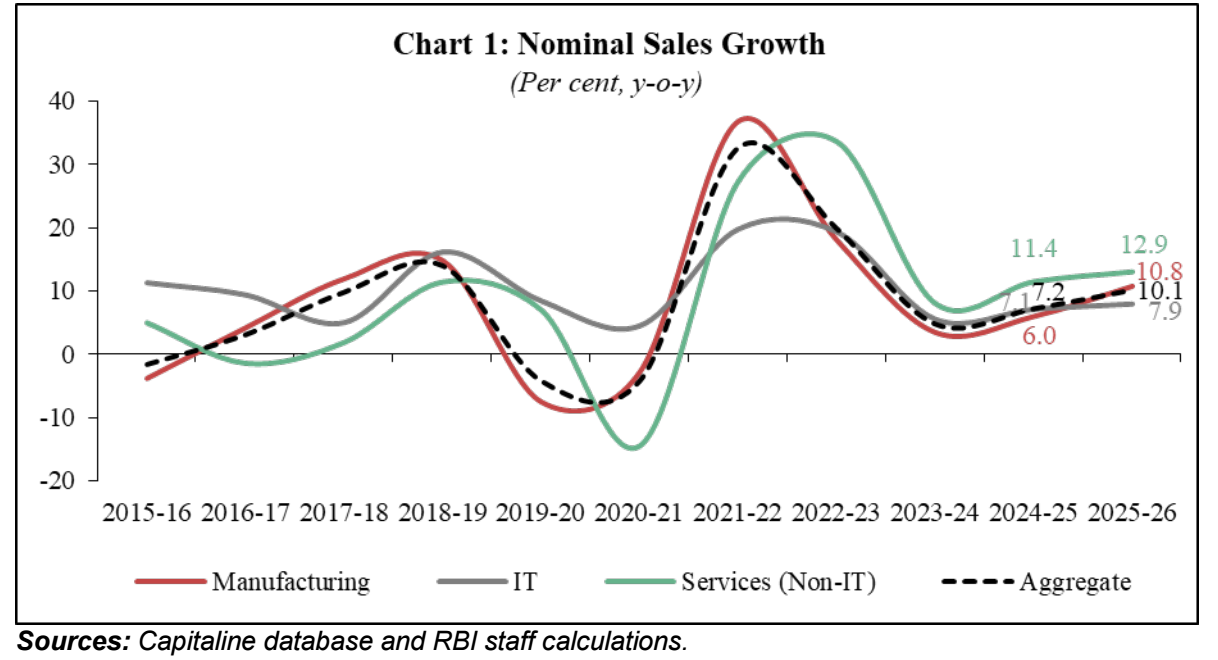
On 24 June 2026, the Reserve Bank of India released a comprehensive study detailing the financial performance of over 4,000 listed, non-government, non-financial companies for the fiscal year 2025-26. The report is encouraging, as India’s corporate sector has made a massive comeback, with sales growth of 10.1 percent at aggregate level, after two years of single-digit moderation.
This turnaround signals a major revival in consumer confidence and domestic demand.
The report analysed the financial performance of 4,278 listed non-government, non-financial companies, which revealed a highly resilient domestic market that successfully absorbed mounting inflationary pressures.
Understanding the Cyclical Recovery
In this context, it is pertinent to understand the pattern of cyclical recovery. The reason a growth rate of 10.1 percent is significant is because of what happened two years ago. The post-pandemic boom had slowed down considerably for Indian companies.
Consumers and companies pulled back due to high inflation, global conflicts and changing interest rates. This created fears among many that the Indian corporate engine is losing steam.
The recent RBI report on the corporate performance in 2025-26 puts these fears to rest. Economists call this a cyclical recovery, which means the economy is moving out of a temporary trough and back into an expansion phase.
This momentum was not confined to just a couple of huge tech conglomerates or retail giants, but was wide-ranging and robust, spreading across manufacturing floors, software tech parks, and regular retail storefronts too.
Manufacturing Leads the Charge
The undisputed hero of this fiscal year was the manufacturing sector. Across India, factories and production plants achieved a double digit growth compared to last year. This acceleration tells us a lot about changing consumer habits; it shows that consumers are finally buying the goods again.
The automotive sector, for instance, experienced higher growth, showing that families are confident enough about their financial futures to make major long-term investments like purchasing new vehicles.
Similarly, electrical machinery and food and beverage manufacturing recorded strong gains. When factories run at higher capacities to meet this demand, it creates a positive ripple effect through the entire supply chain, generating secondary employment and stabilising smaller vendor businesses.
Sales Growth and Expenditure
A look at the numbers reveals that the economic revival was mainly led by manufacturing and services. Sales of manufacturing sector companies expanded by 10.8 percent in 2025-26, compared to 6 percent growth in the previous year, mainly driven by automobiles, electrical machinery, food and beverages and chemicals industries.
At the same time, the petroleum industry showed a contraction in sales in 2025-26. Meanwhile, IT sector sales grew by 7.9 percent compared to 7.1 percent in the previous year, while the non-IT service sector showed a growth rate of 12.9 percent in 2025-26.
In terms of expenditure, the raw material expenses for manufacturing companies increased by 12 percent and the raw material-to-sales ratio climbed to 57.6 percent in 2025-26 compared to 55.7 percent a year ago, which indicates input cost pressure. Also, the staff cost was up by 10.7 percent for manufacturing, 6.1 percent for IT, and 9.0 percent for non-IT services during 2025-26.
The staff cost-to-sales ratio stayed largely stable for manufacturing companies but it decreased for services companies.
Pricing power and Interest expenses
Even though the input costs were high, operating profit growth for manufacturing companies managed to grow to 10.3 percent in 2025-26, compared with 6.0 percent a year ago.
And in the services sector, the operating profit growth of non-IT services companies actually slowed down to 7.1 percent in 2025-26 while for IT companies it improved to 10.7 percent.
In 2025-26, the operating profit margin eased, down by 30 basis points (bps) to 13.9 percent for manufacturing, and 210 bps to 20.0 percent for non-IT services companies, respectively.
For IT companies, however, the same margin was up by 50 bps to 22.4 percent.
Due to an increase in gross profit along with fall in interest charges, the manufacturing firms’ Interest Coverage Ratio (ICR) increased to 9.1in 2025-26 from 7.9 in the last fiscal year.
On the other hand, in the services sector, ICR of non-IT services companies remained the same at 2.2 in 2025-26 as in the last fiscal year, but for IT companies, it remained at a high level.
What This Means for the Common Citizen
When we solve this puzzle together, the main picture shows that the Indian economy in 2025-26 is one of undeniable resilience. A strong sales growth rate of 10.1 percent means better corporate profit, increased employment and steady household income. The robust domestic demand has proven strong enough to pull companies out of a two-year slump, despite global uncertainty and expensive raw materials.